IoT Weather Station with RPi
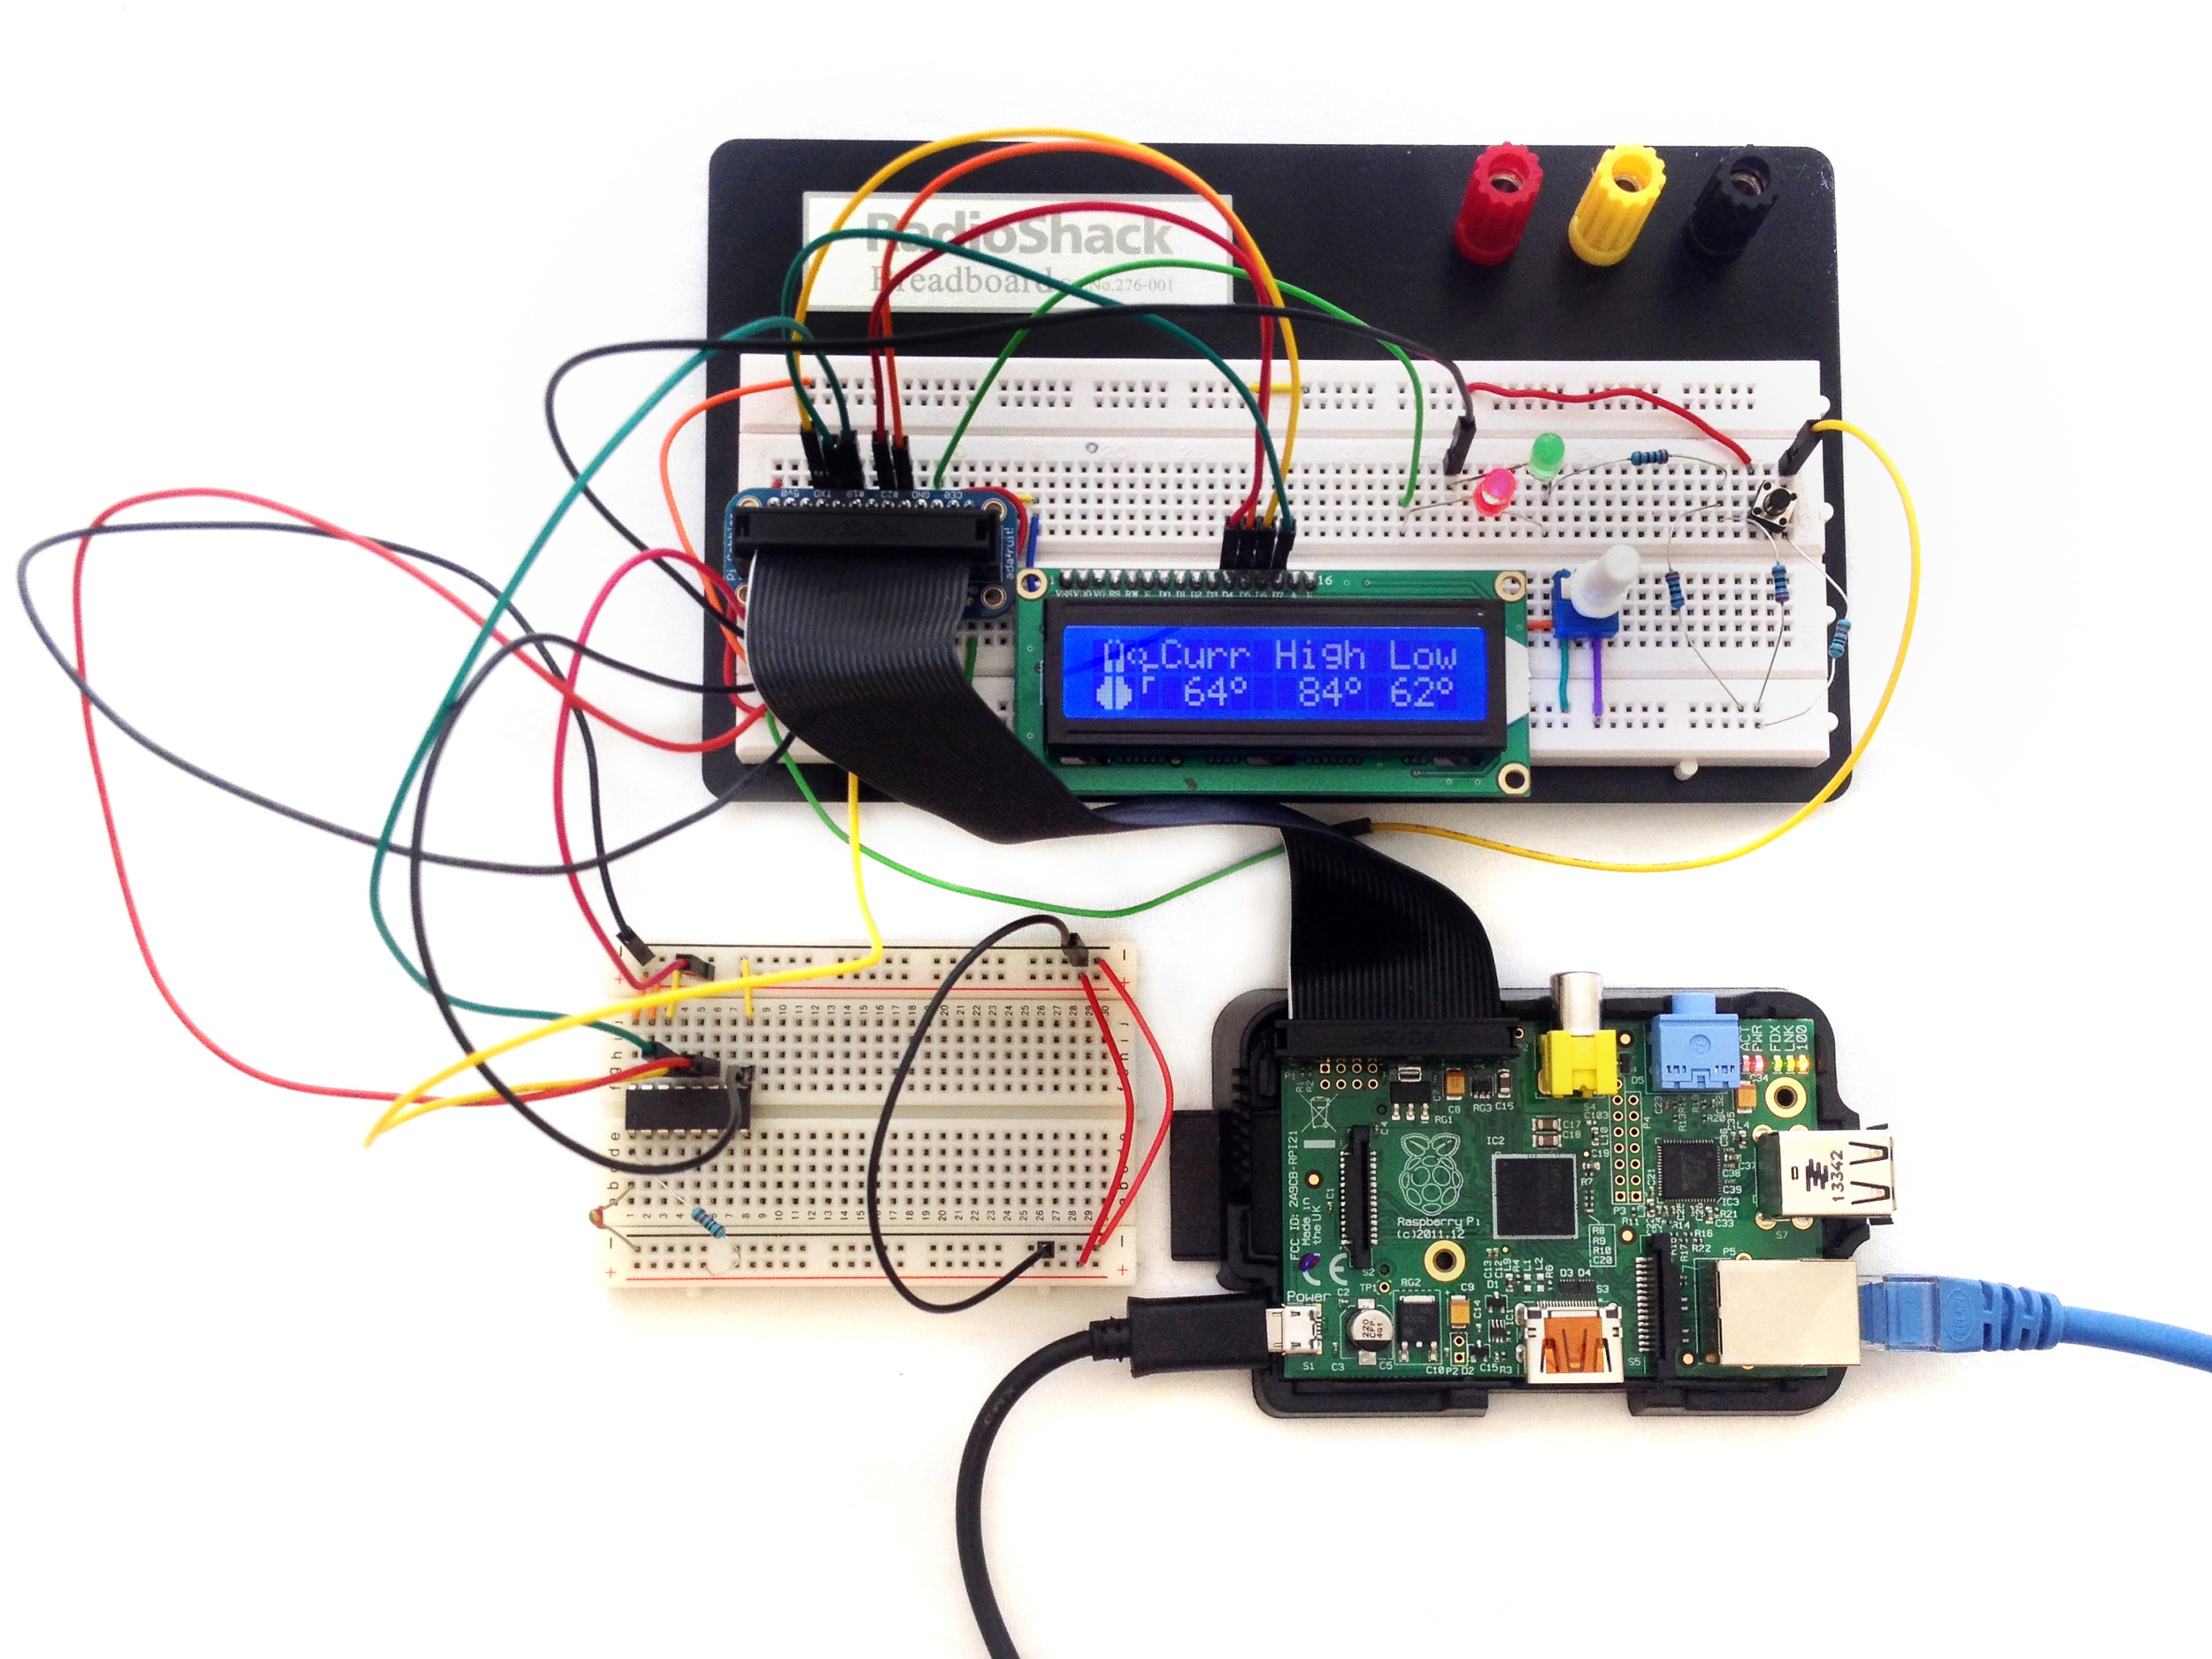
This was the final project in EECS 113 (processor hardware/software interfaces) at UC Irvine, Spring 2014. The course focused on embedded system design and assembly programming with the 8051 instruction set. The project required the use of an LCD (Hitachi 44780 variant), analog sensors, an ADC, and the Raspberry Pi to create a weather-reporting device. Teams of three were required to interface the hardware and develop software in C to display (at a minimum) three screens of weather-related data. The system was required to fetch data from the California Irrigation Management Information System (CIMIS) to include irrigation scheduling and pump control. Attention to project robustness (added features) and aesthetics (organization and design of LCD screens) were also noted as grading criteria, yet specifics on extending features was left to the discretion of the team.
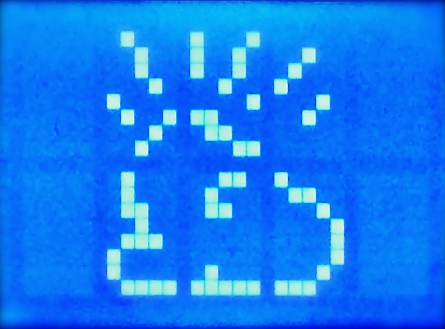
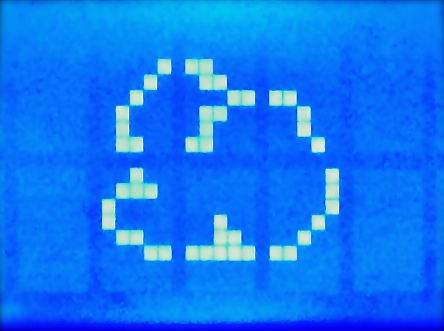
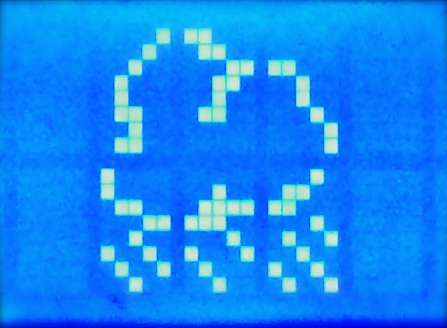
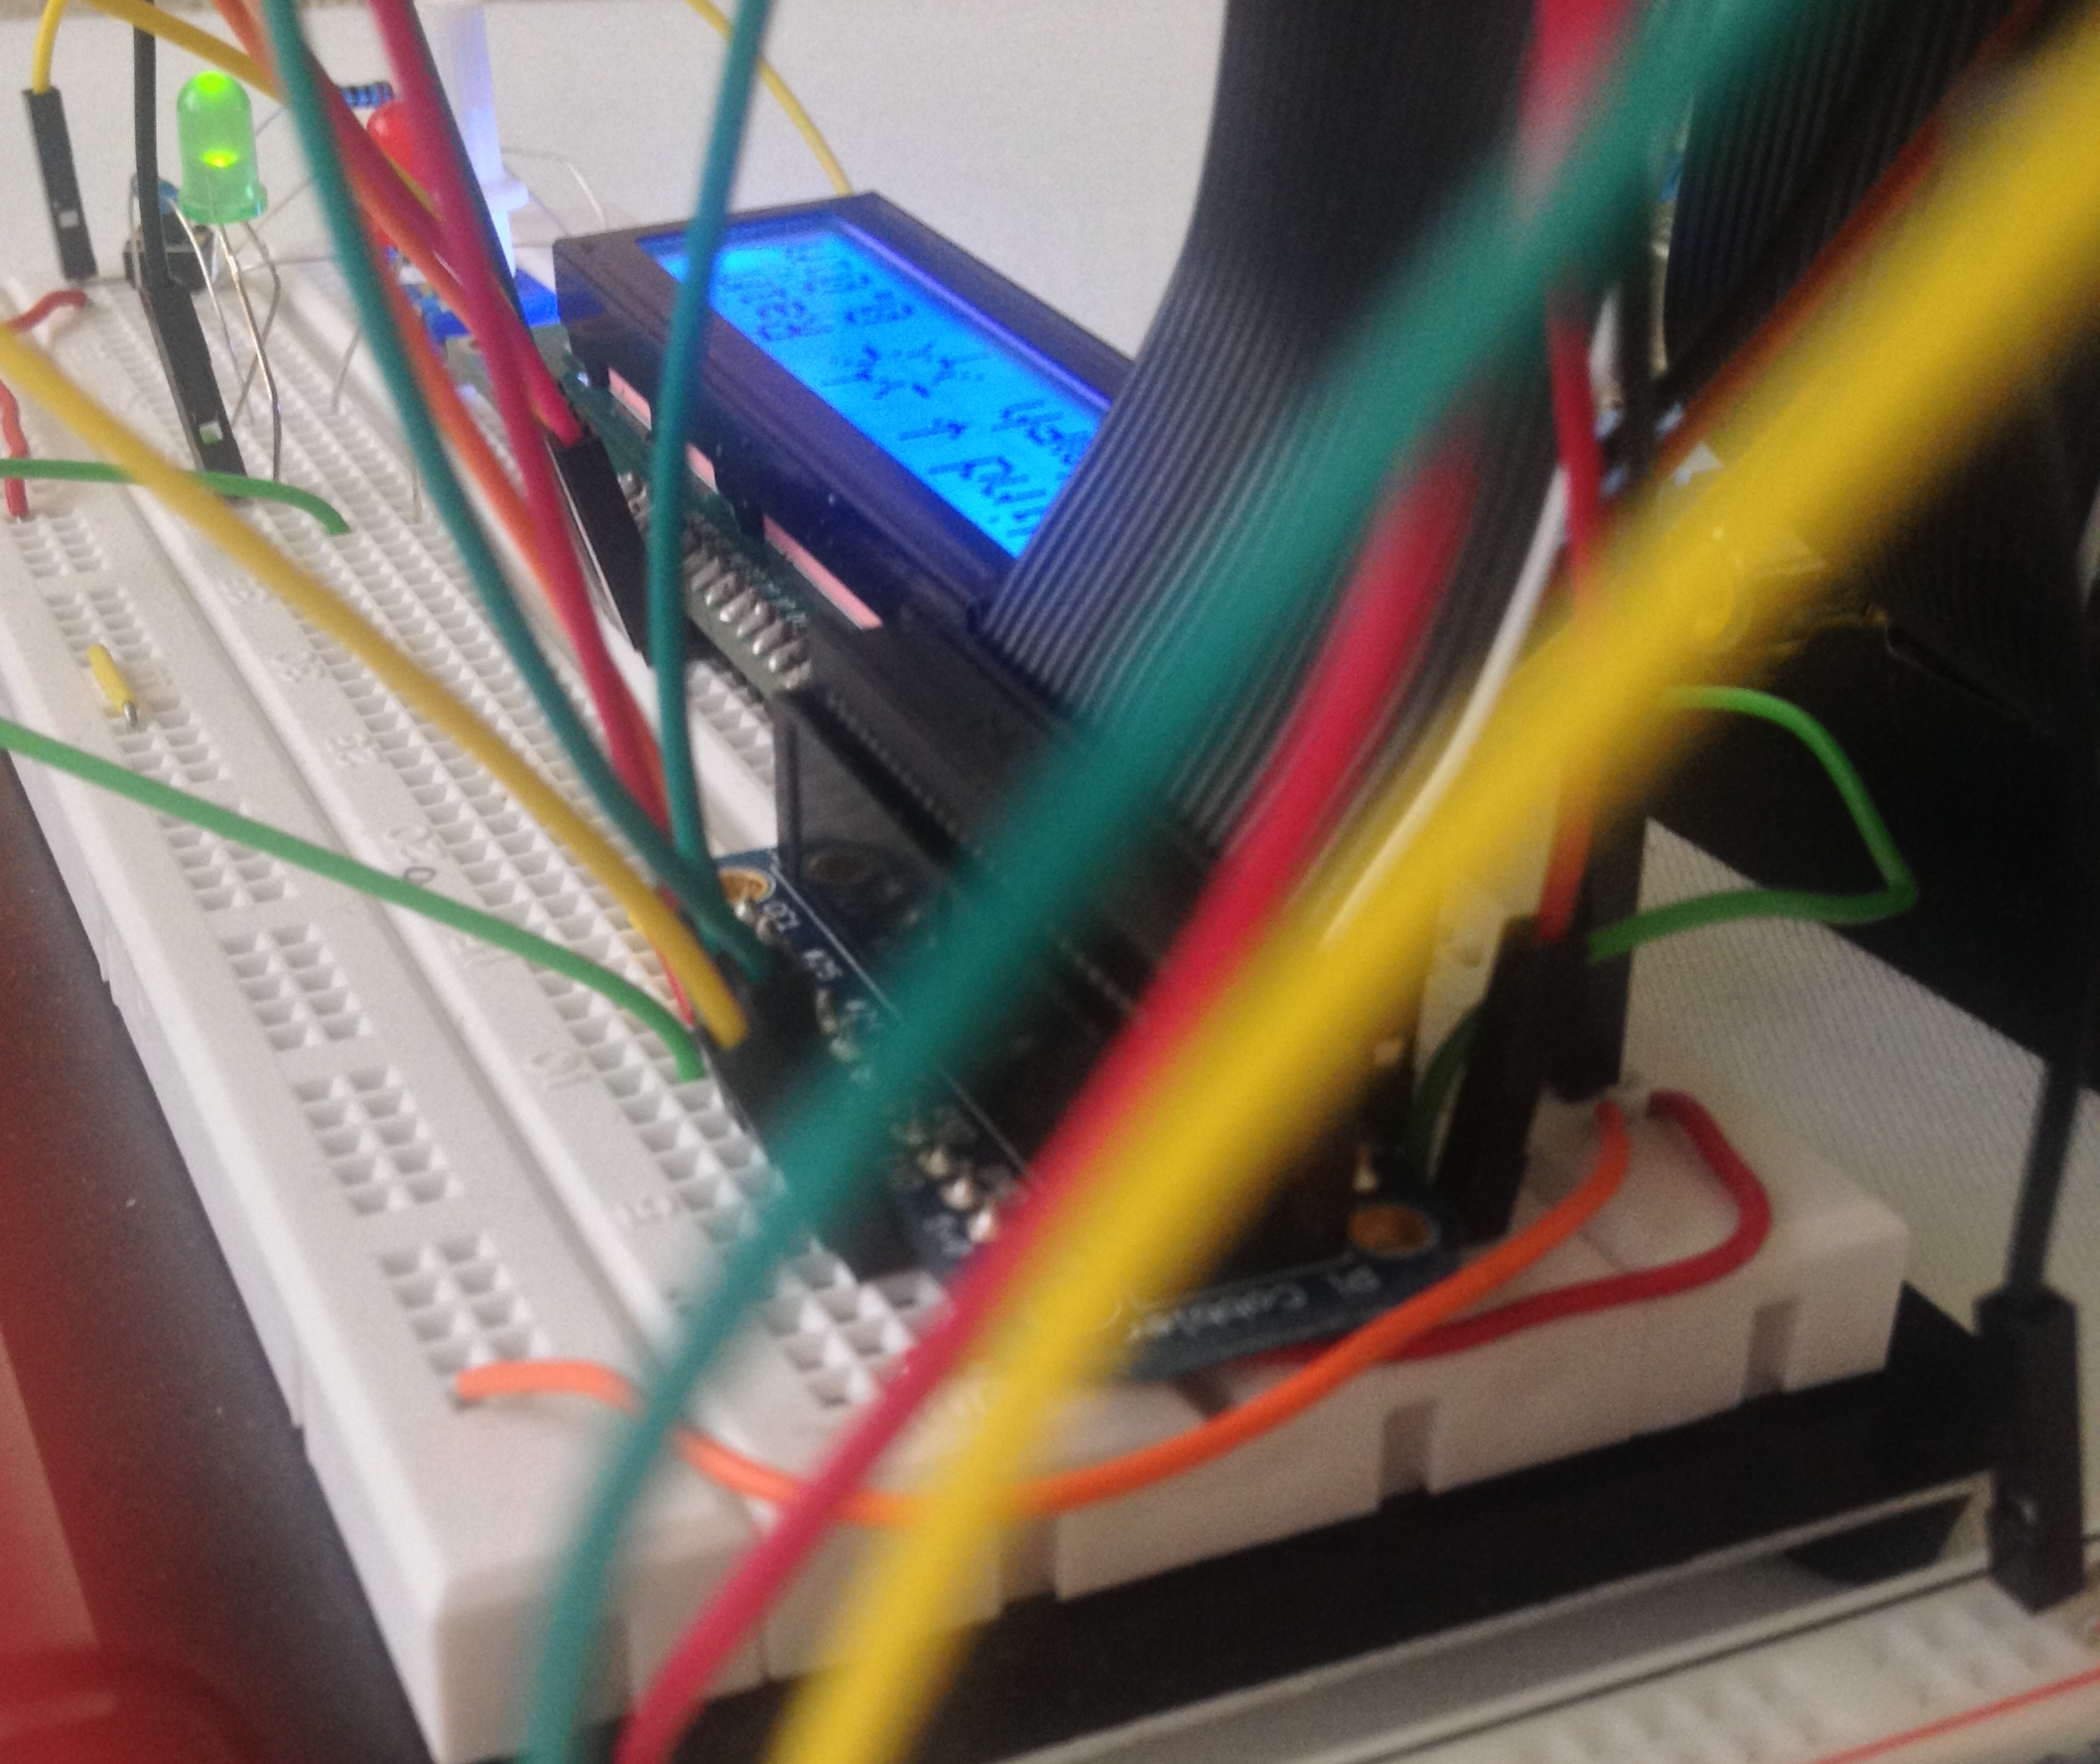
A slideshow of the completed project is provided below. For more details, please see the project report.
Tools Used
Raspberry Pi, WiringPi Library, EdSim51, GCC, GDB, Emacs, Fritzing, LaTeX/LyX
Contribution
Principal Hardware/Software Architect, LCD Graphics Design, Testing/Debugging, Project Report
Development Process
Preliminary Setup and Preparations
- Installed WiringPi library (GPIO access for the BCM2835 processor and HD44780U LCD)
- Researched WiringPi documentation and tested relevant library functions
- Defined scope of data to be retrieved from CIMIS
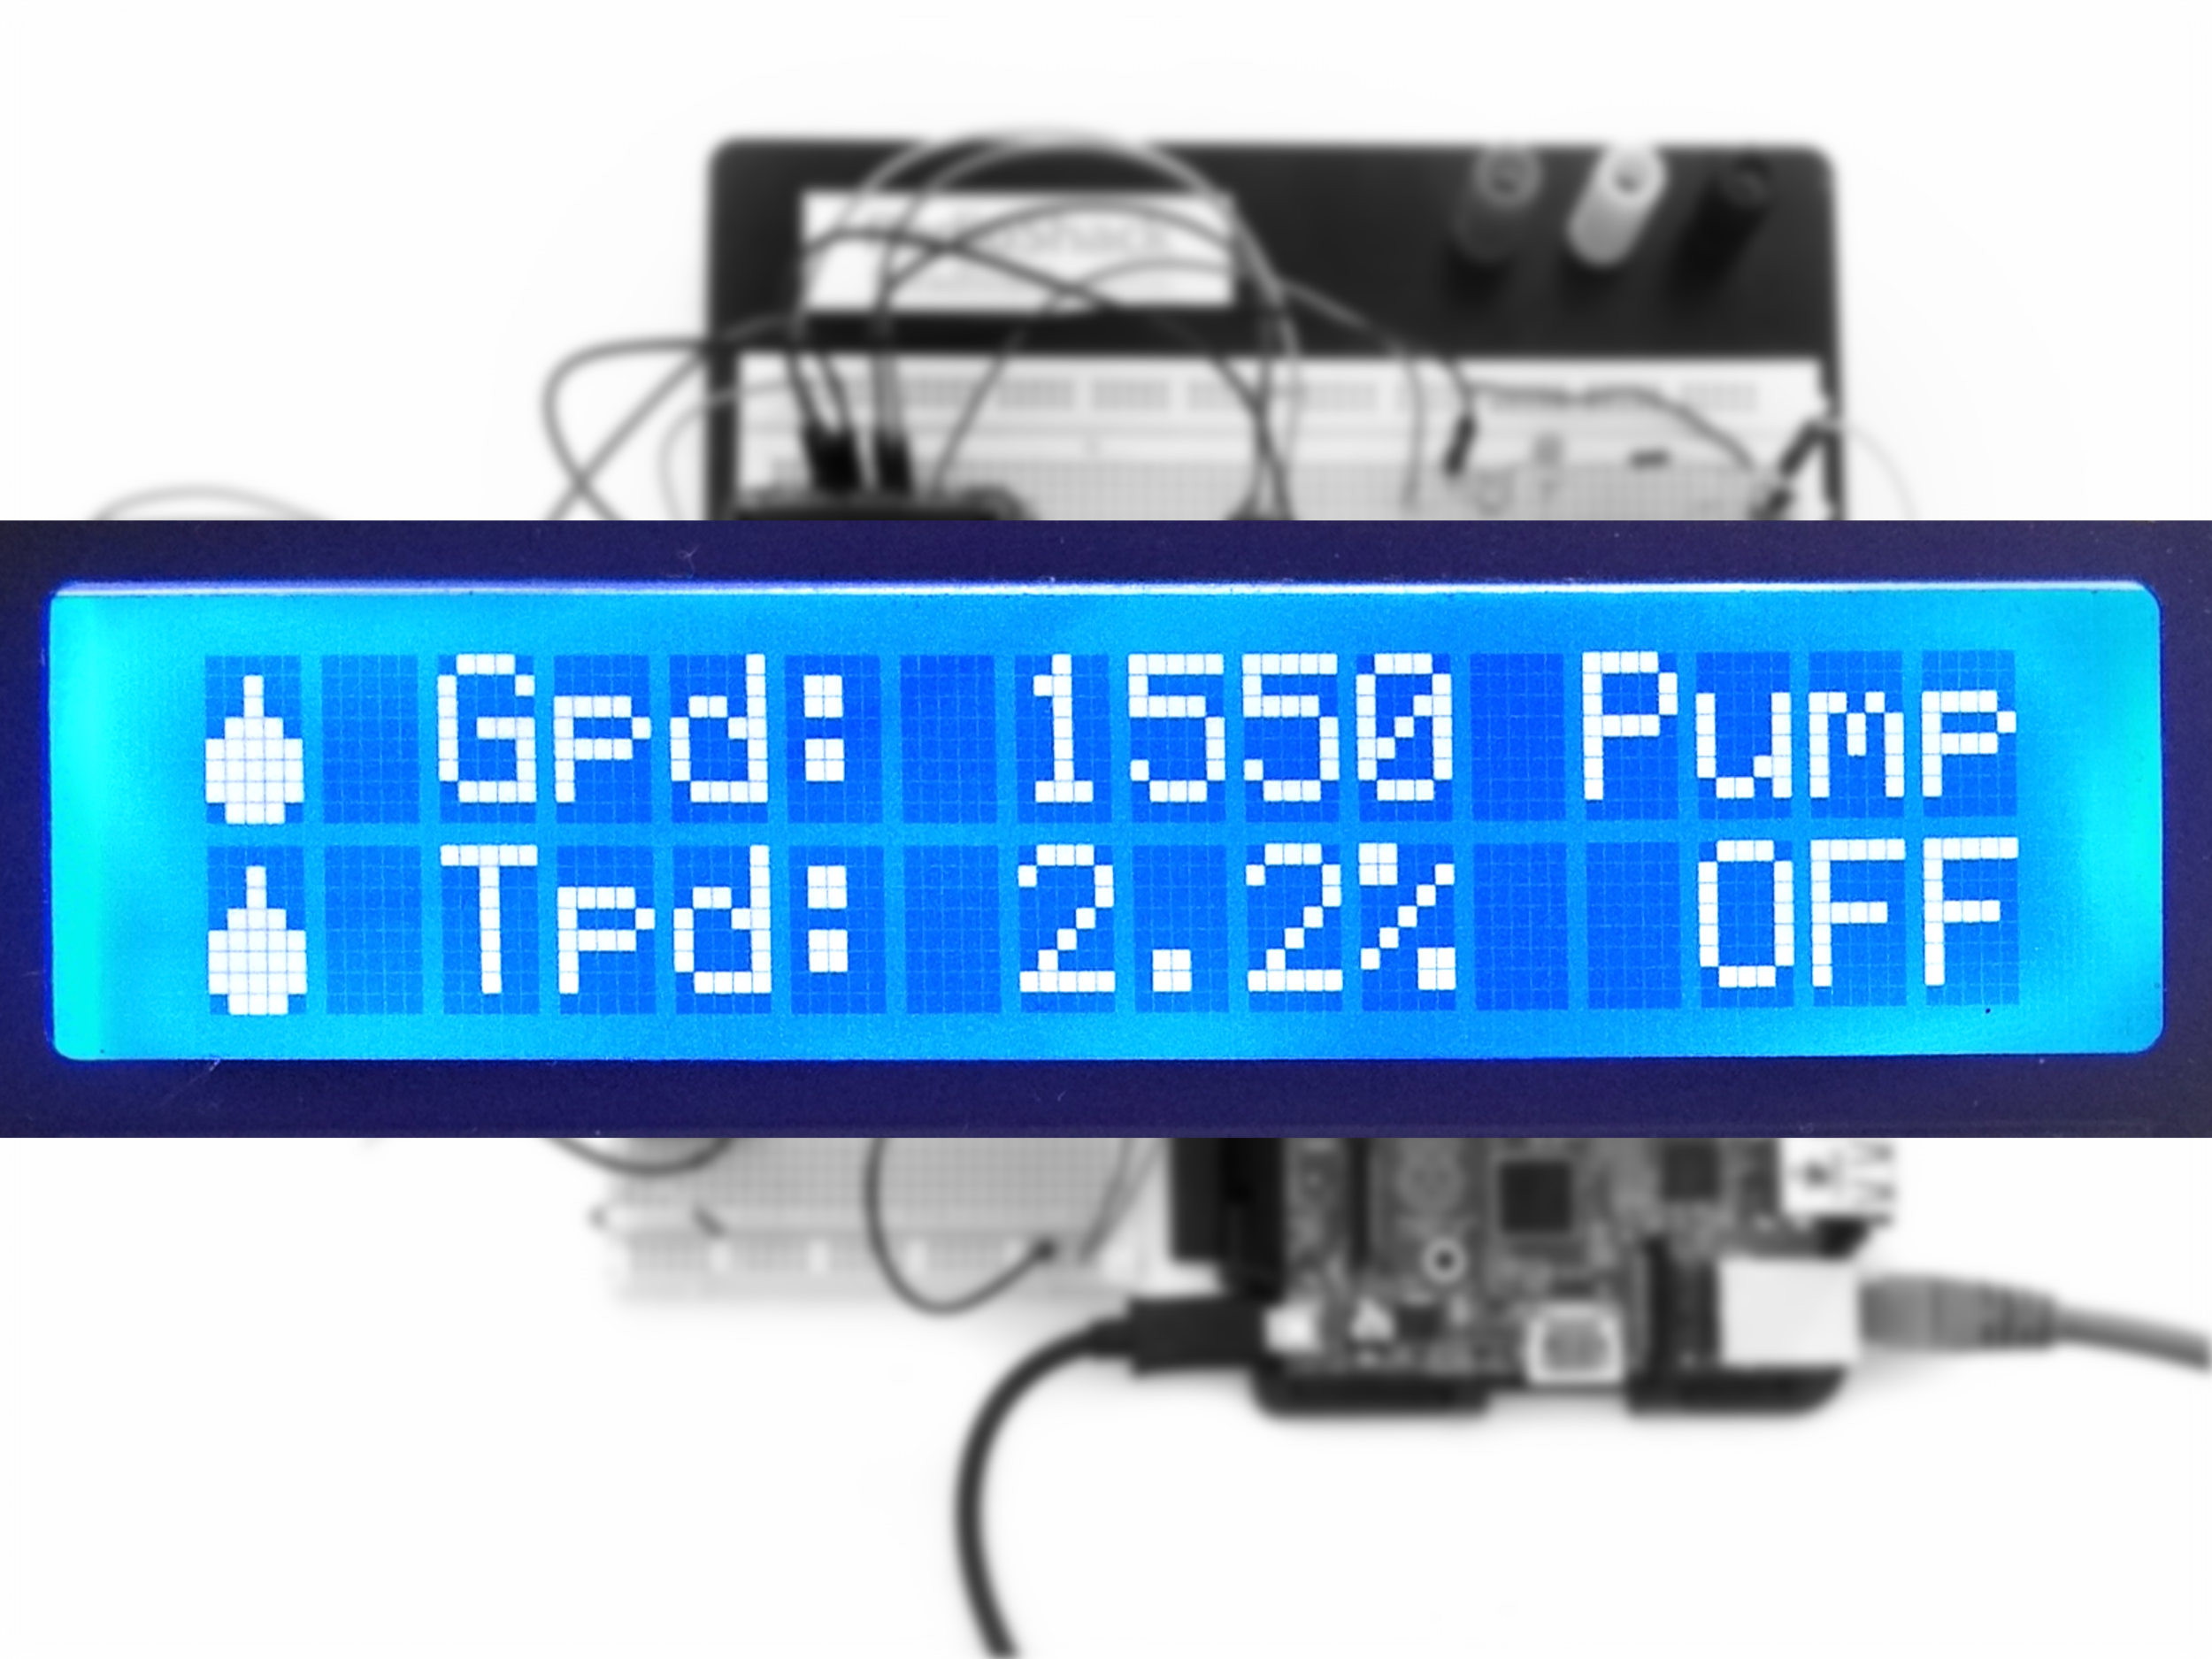
- Designed screen layouts
Software Development
- Designed the software specification
- Developed the function prototypes and definitions for rendering images/data to the LCD, fetching CIMIS data, irrigation operations, etc.
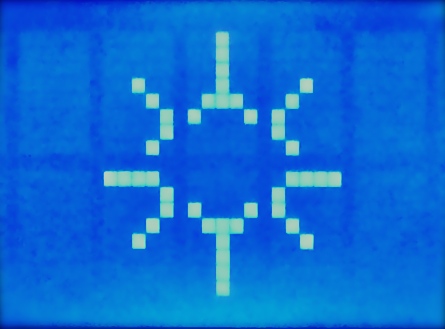
- Designed special LCD characters for temperature icon, cloud cover conditions, wind directions, and irrigation icon
Hardware Design
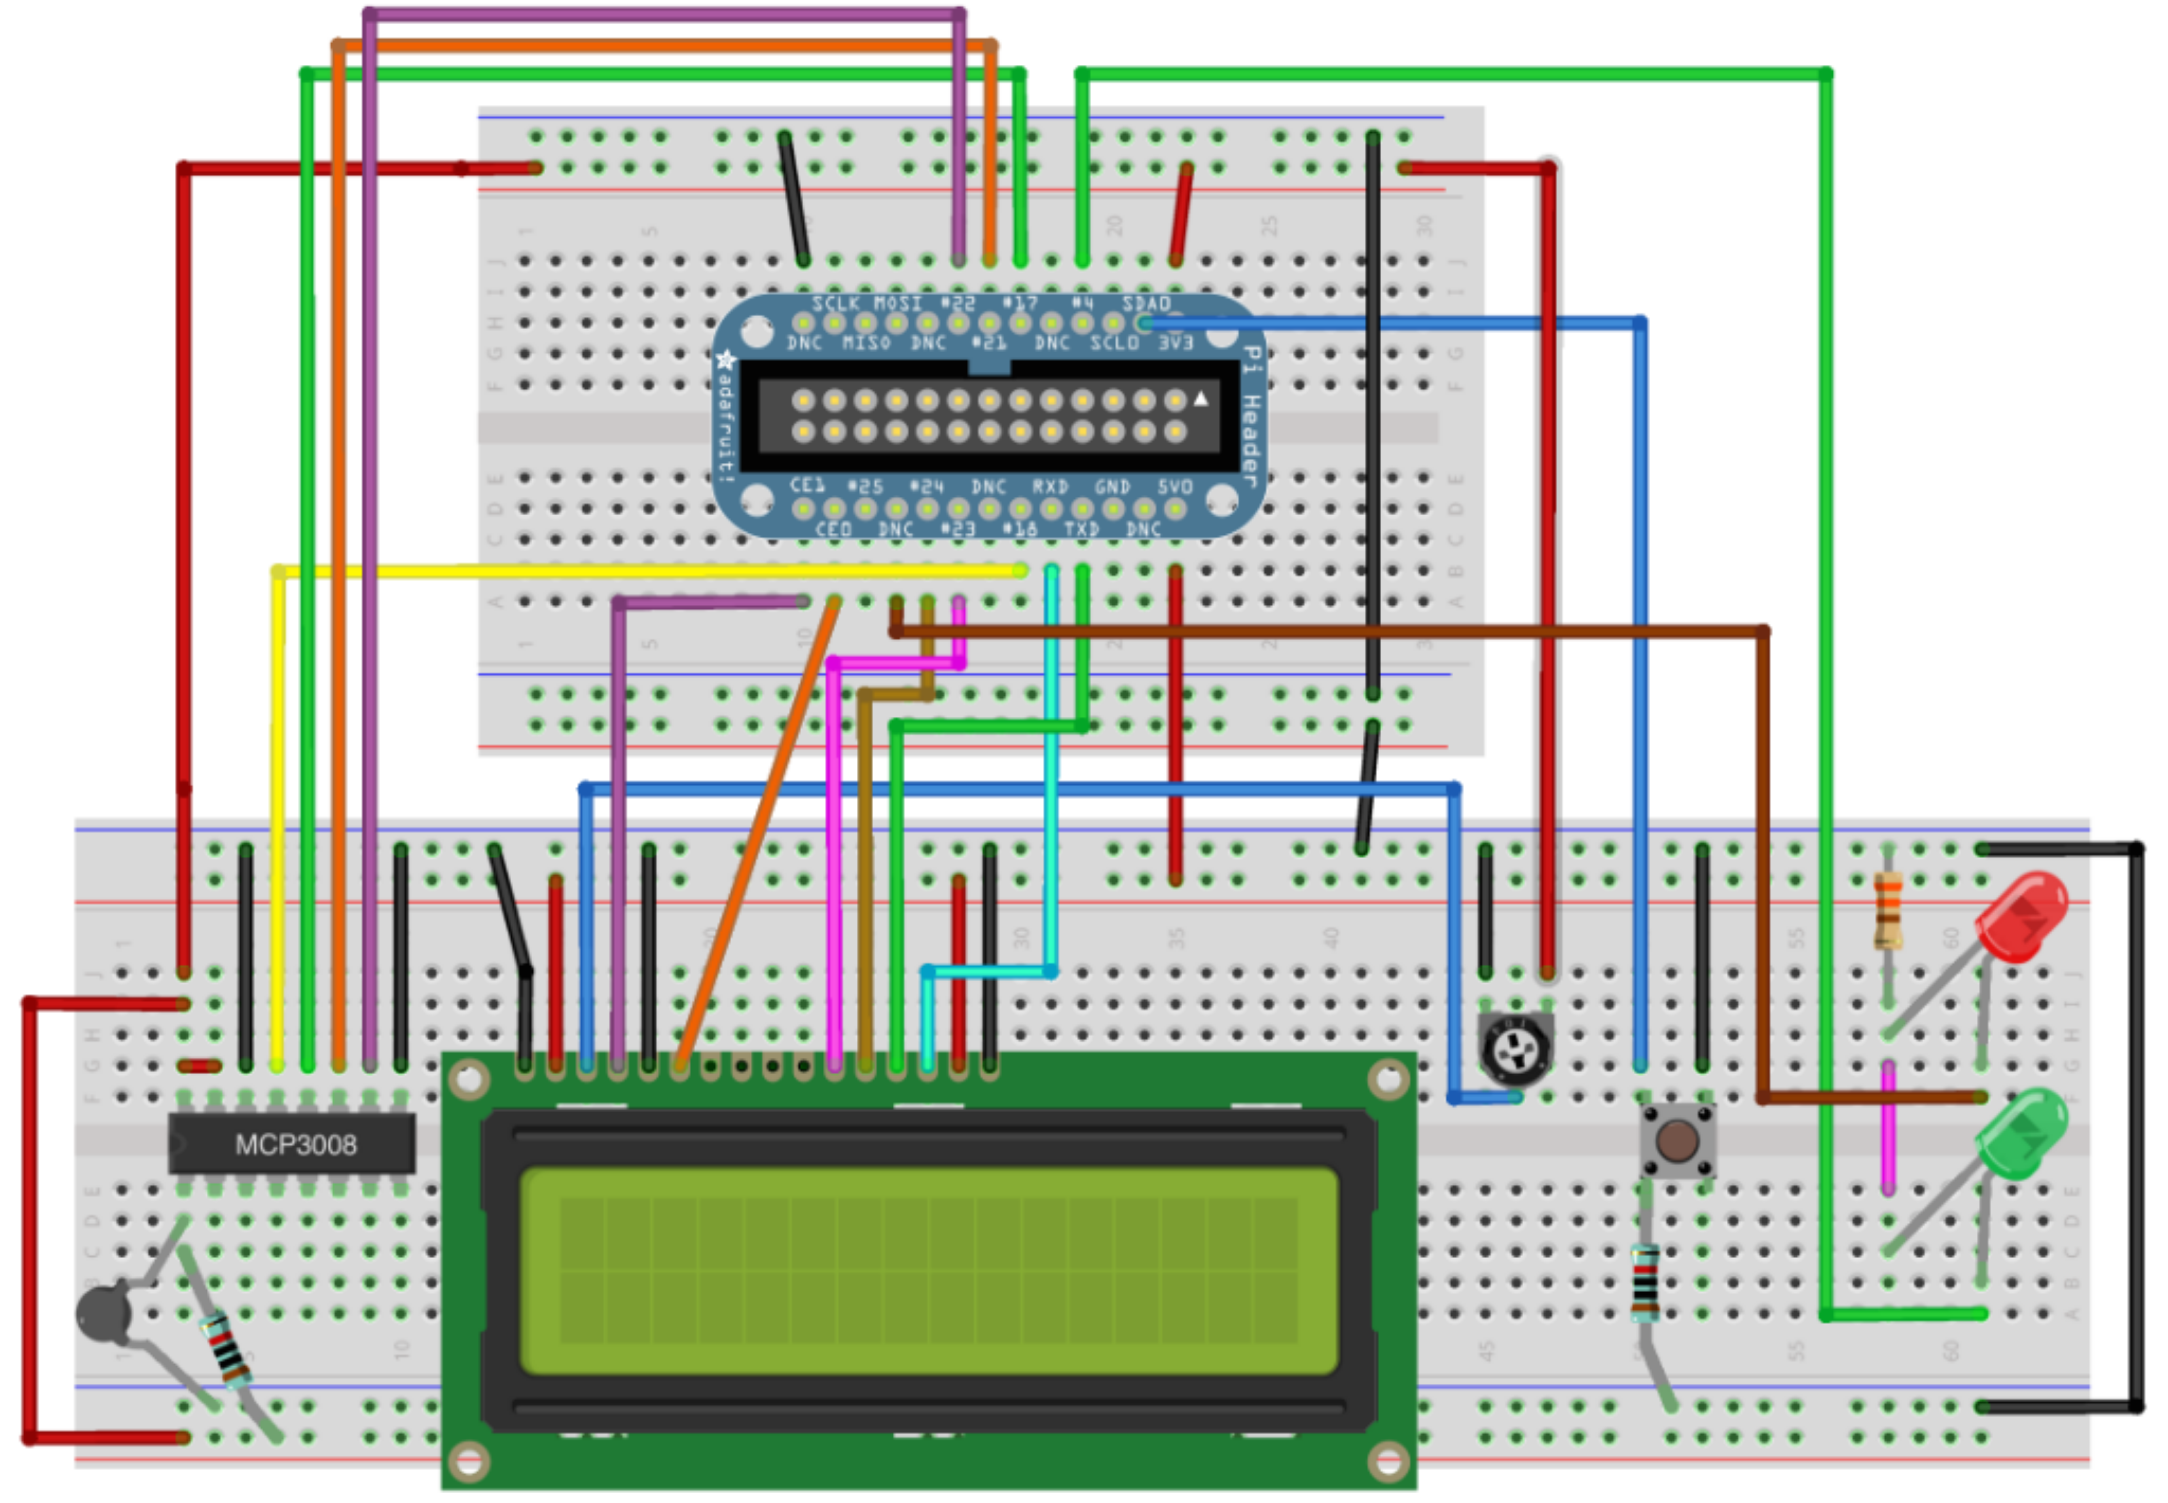
- Interfaced the following hardware with Raspberry Pi:
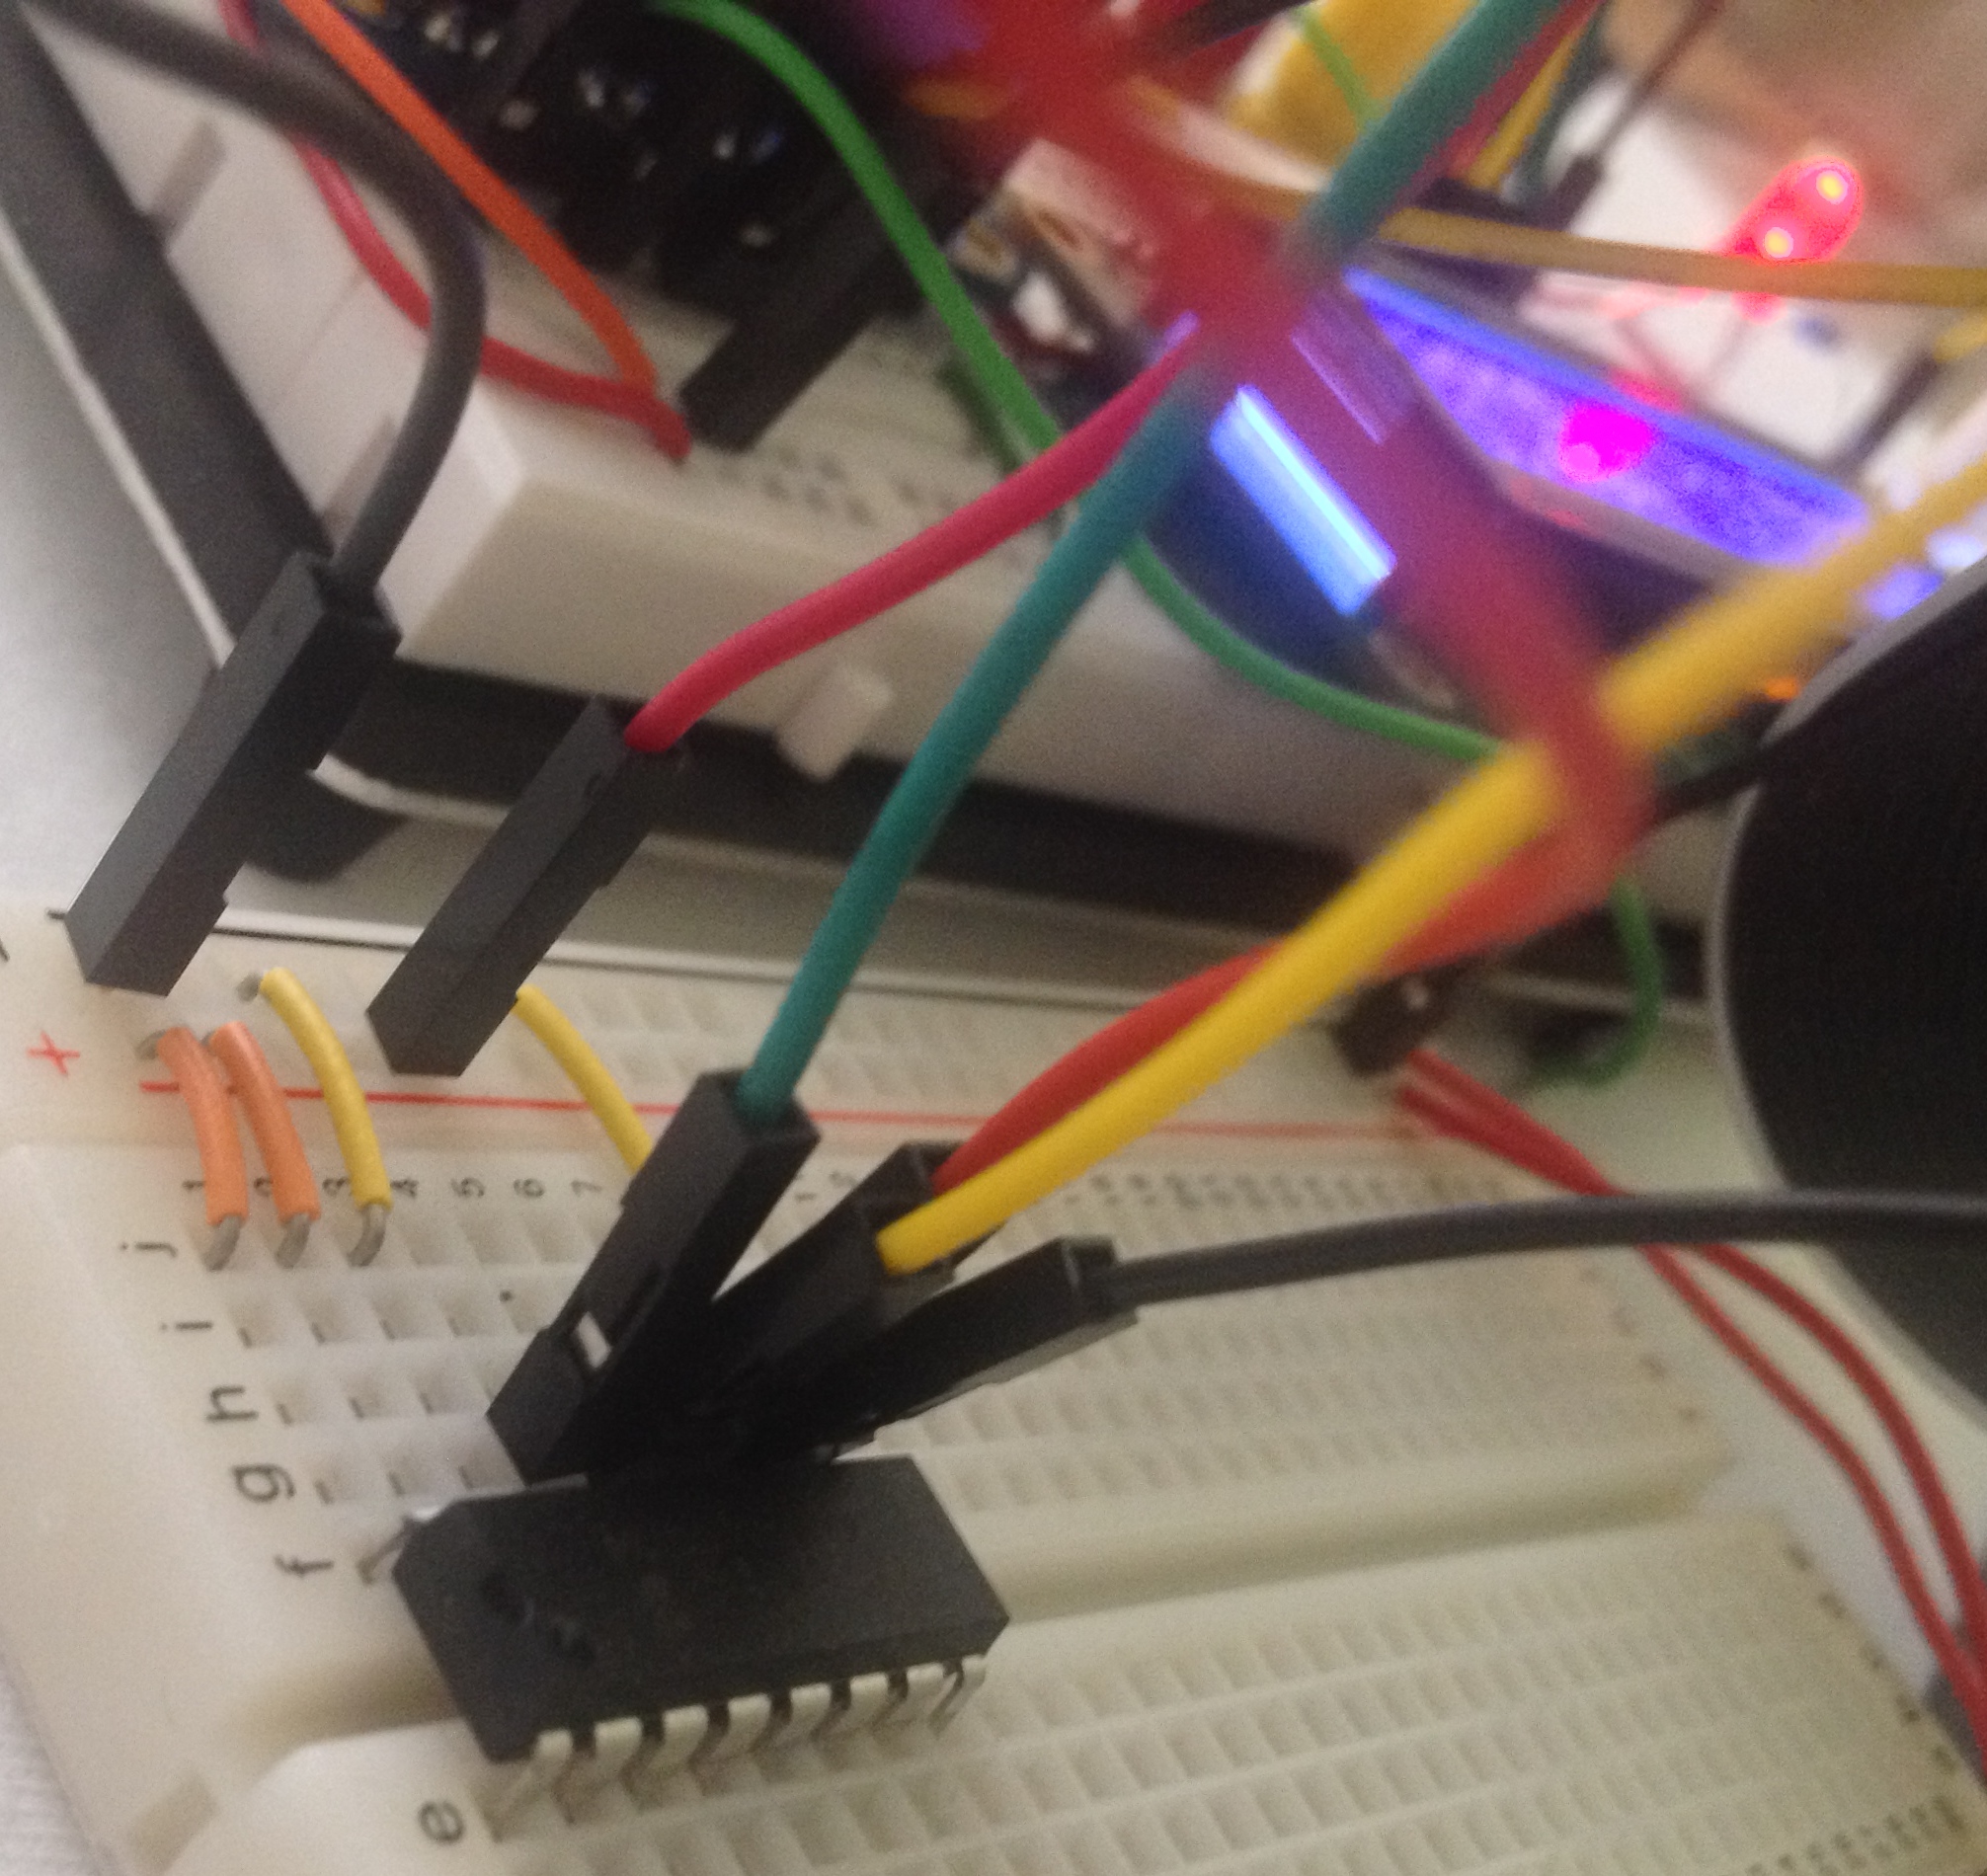
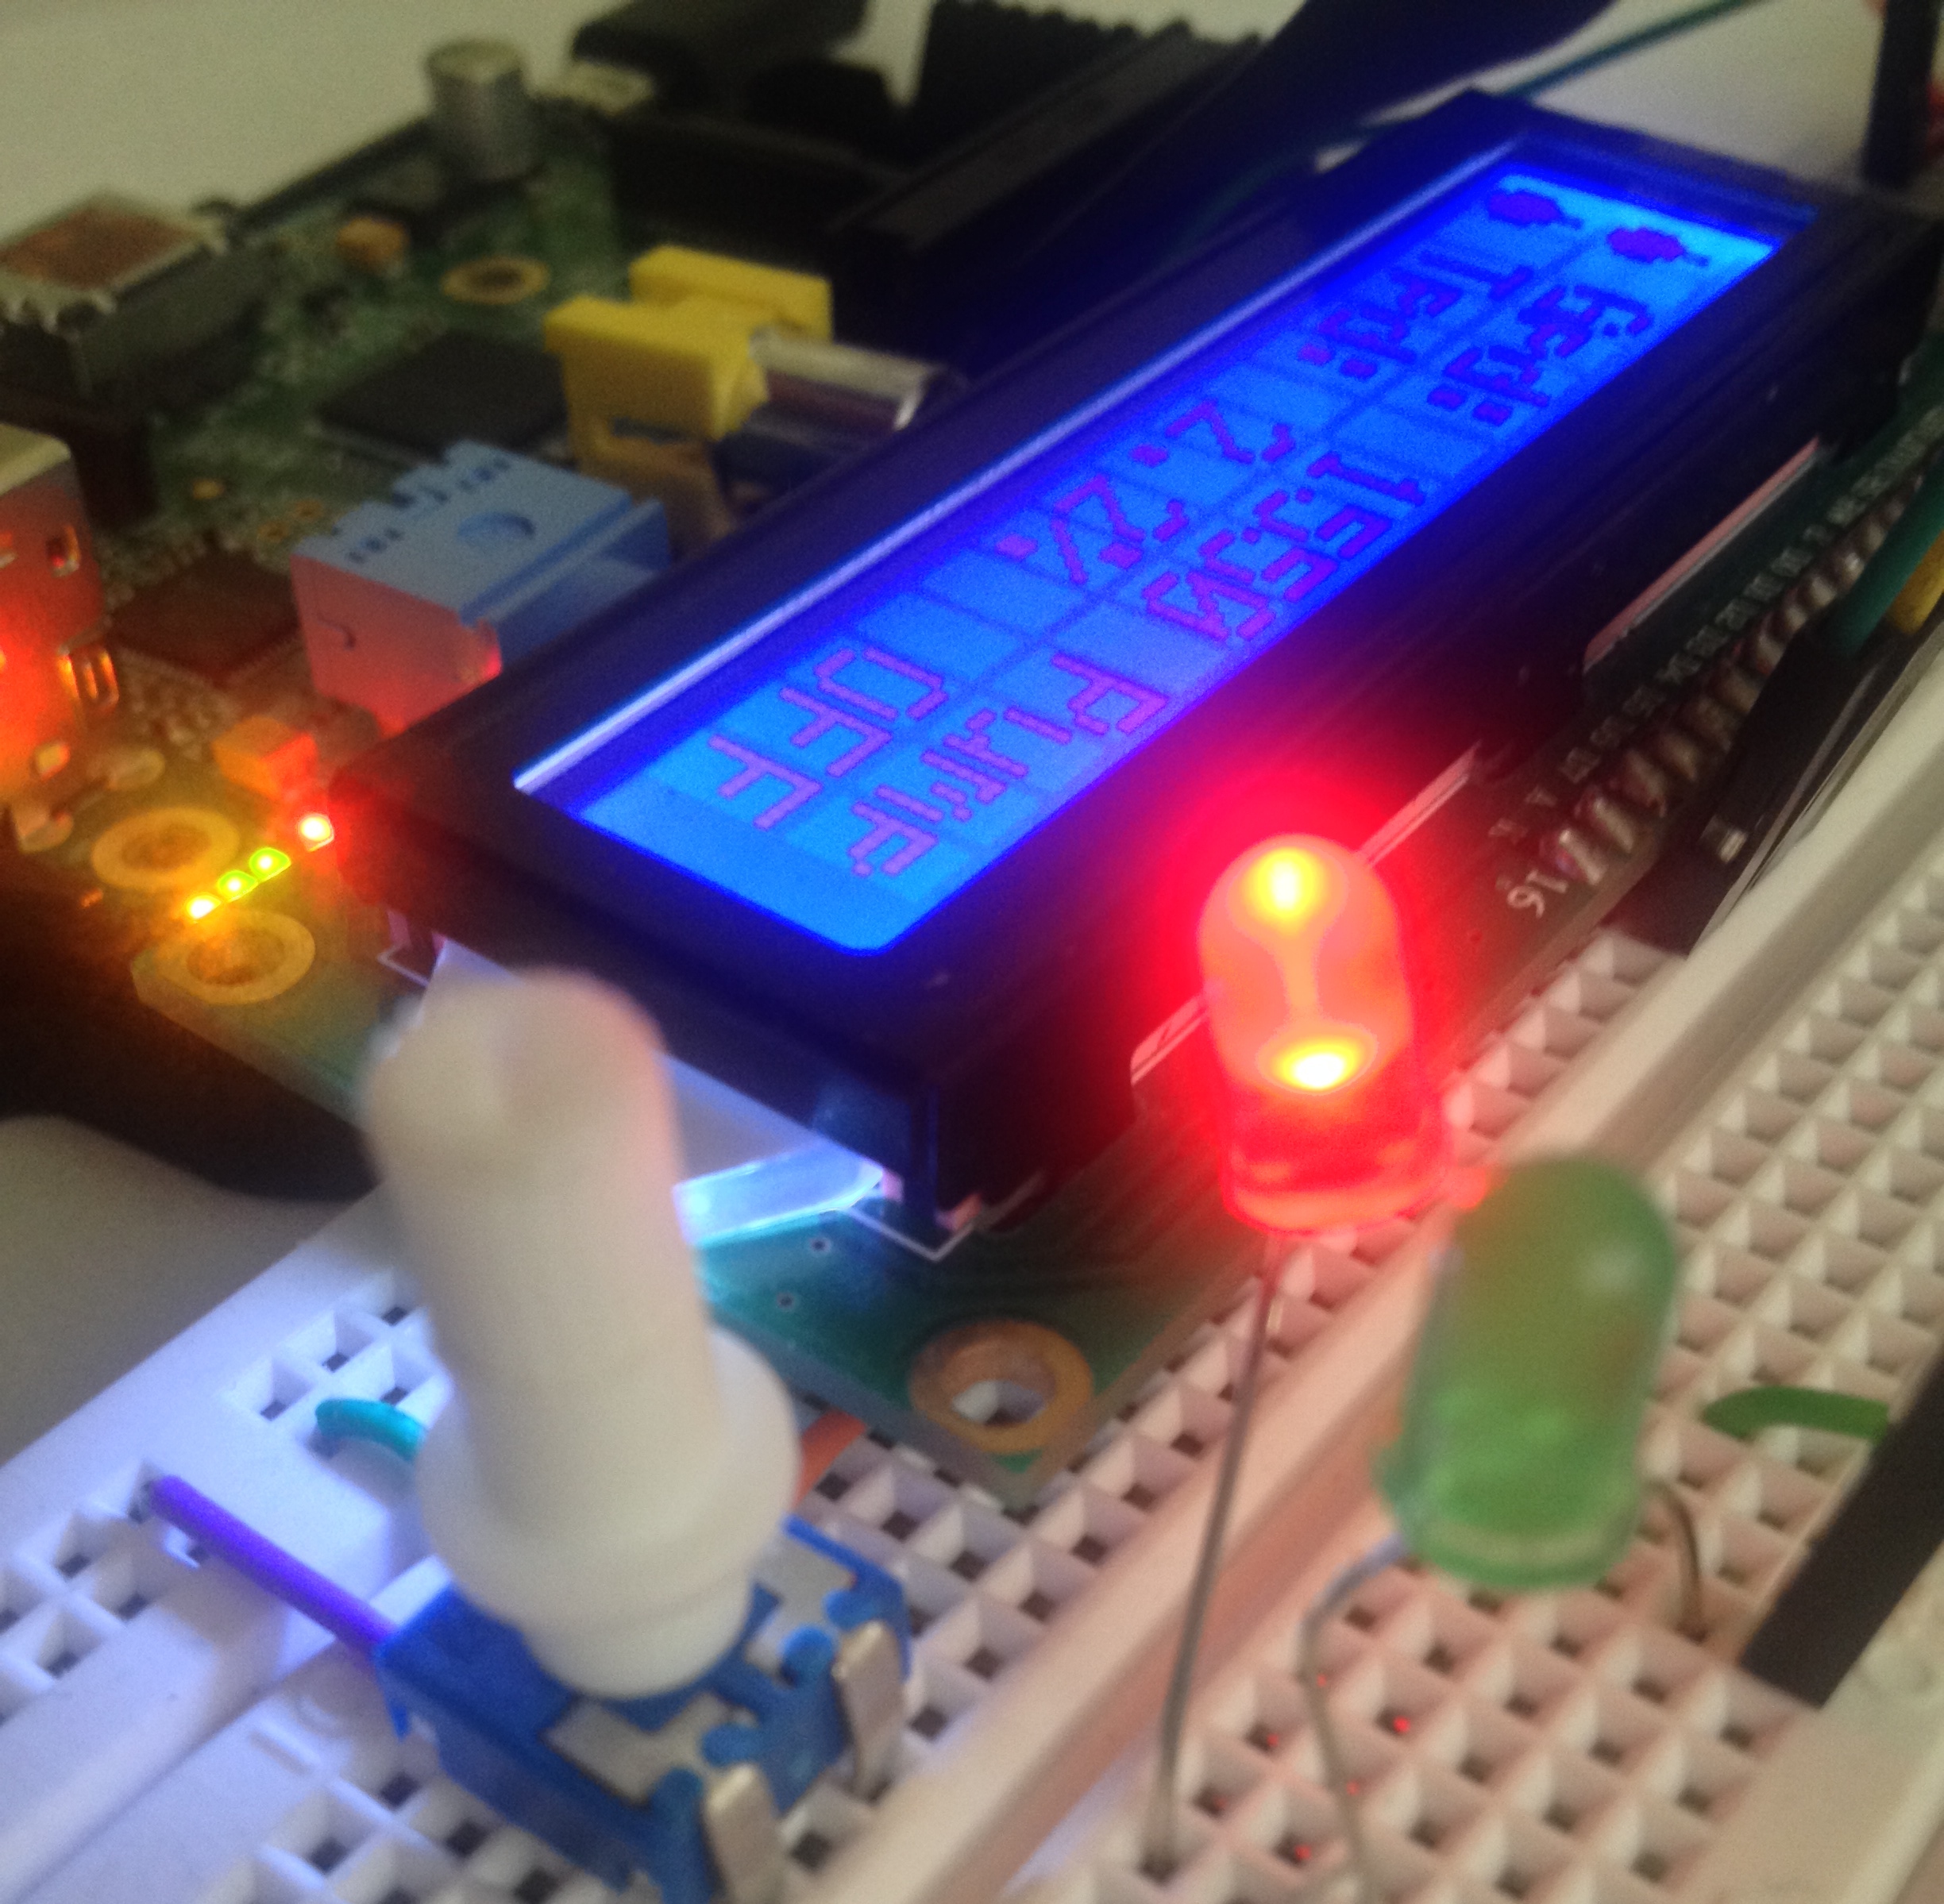
- LCD, 10k trimmer, and push button for displaying/selecting each screen
- ADC and thermistor for reading ambient temperature
- Red and green LEDs for indicating pump on/off states
Project Report
- Created graphic assets such as Fritzing diagrams and project photos
- Documented software specification
- Prepared report utilizing LaTeX and LyX
Personal Reflections
This project, and the course as a whole, exposed me to hands-on experience with embedded systems design. This was an exciting and new opportunity for me to actually combine programming and hardware. Many concepts that previously existed as disparate courses (e.g., circuit theory, low-level programming, and signal processing) converged here to provide a cohesive hands-on experience. Although the Internet-Connected Smart Weather Meter is a primitive example of an embedded system, it reinforced my aspirations to create and program embedded devices that solve problems and lend convenience to the human experience.
