Since familiarizing myself with MATLAB via an online course, many of my thoughts have centered around how I can utilize it for my own purposes. While currently drafting a new project involving machine vision, the utility of MATLAB has become obvious. In preparation for that project, I am going to perform a series of exploratory exercises using Arduino, Raspberry Pi, sensors, and MATLAB. As such, this is a first in several posts detailing my experiments.
For this first exercise, the goal is to get the Arduino Uno and MATLAB communicating and graphically display the results. In addition to the great resources found on the MATLAB website, I found a good set of examples detailing MATLAB/Arduino interfacing at matlabarduino.org. The steps are as follows:
- Connect Arduino to accelerometer — I am using the LSM303DLHC.
- Write/upload a sketch that reads the accelerometer and prints the values to the serial port.
- Write MATLAB code that reads values from the serial port and plots them as vectors in 3D space.
Arduino and LSM303dlhc
For those unfamiliar with using accelerometers with Arduino, Adafruit provides library links, code explanations, and assembly/connection instructions for the LSM303DLHC. Below is my setup, which stabilizes the board/accelerometer and allows for rotating/manipulating the rig in 3D space.
Arduino Uno and LSM303DLHC accelerometer.
Serial Communication between Arduino and matlab
The complete code for this exercise is available on my matlab-arduino repo. The snippets below show the handshake between Arduino and MATLAB, which verifies that serial data is being sent/received on both ends. First, MATLAB waits for Arduino to send 'a' to the serial port, and then notifies the user that serial data is being received:
 % handshake btwn matlab & serial device
 a = 'b';
 while(a ~= 'a')
 	a = fread(obj.dev,1,'uchar');
 end
 if(a == 'a')
 	disp('serial read');
 end
 fprintf(obj.dev,'%c','a');
 mbox = msgbox('Serial Communication setup.'); uiwait(mbox);
 fscanf(obj.dev,'%u');
On the Arduino side, the setup() function prints 'a' to the serial port and waits for MATLAB to send a response:
// handshake between arduino and serial port
Serial.println('a');
char a = 'b';
while(a != 'a') {
	a = Serial.read();
}
Once the handshake between Arduino and MATLAB has completed, we enter the loop() function, read the accelerometer, and print to the serial port.
if(Serial.available() > 0) {
	mode = Serial.read();
    if(mode == 'R') {
      sensors_event_t accelEvent;
      accel.getEvent(&accelEvent);
      accelRead = accelEvent.acceleration.x * scaleG;
      Serial.println(accelRead);
      accelRead = accelEvent.acceleration.y * scaleG;
      Serial.println(accelRead);
      accelRead = accelEvent.acceleration.z * scaleG;
      Serial.println(accelRead);
    }
    delay(20);
}
plotting vectors with matlab
Although the videos from matlabarduino.org are informative, I encountered a few problems with their tutorials. First, code from the examples is not provided — this could actually be viewed as a benefit, as it forces one to develop the code on their own. Second, some of their MATLAB code that is actually viewable from the videos doesn't work well. For example, the calibration function resulted in the x-vector as being approx. 1g when it should be zero. Also, aspects of the GUI code resulted in references to dead objects. Again, my version of the code is on GitHub.
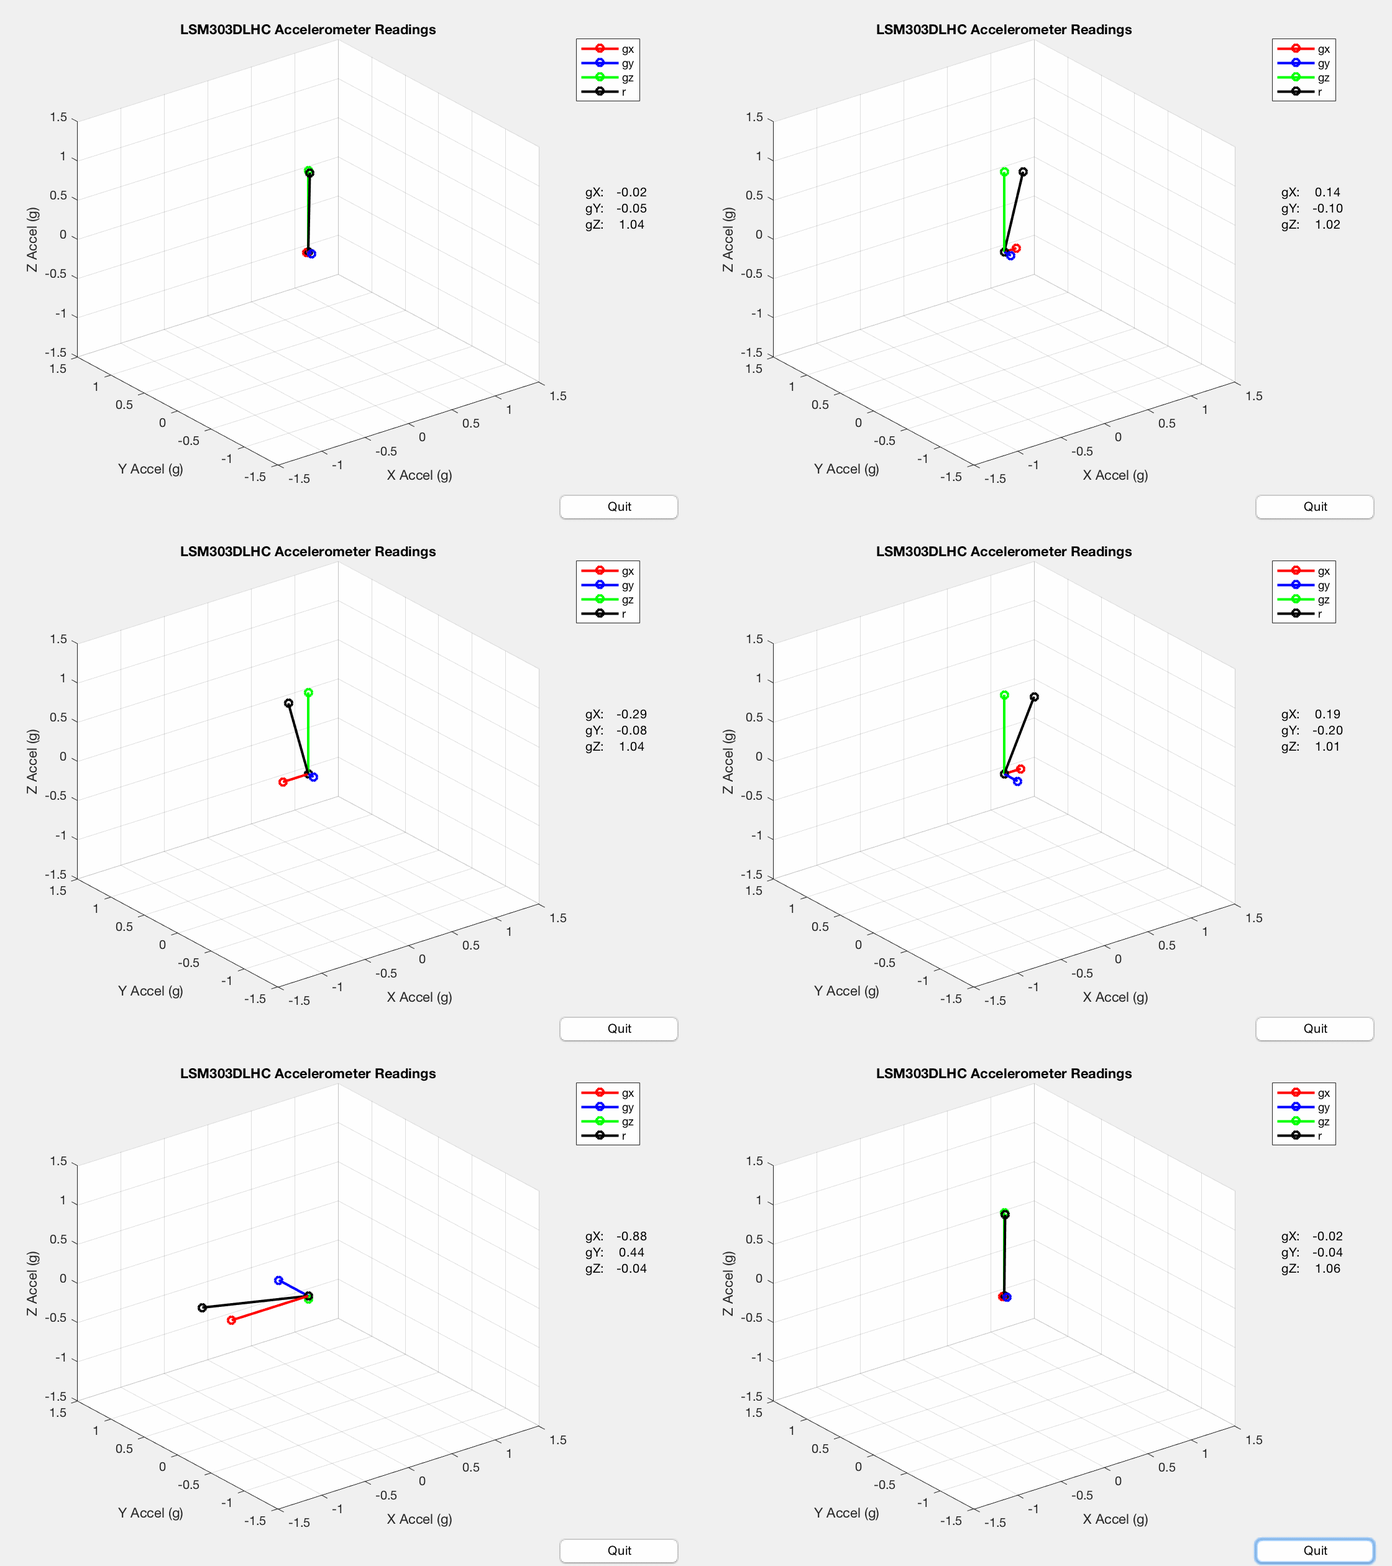
MATLAB reads x, y, and z accelerations printed to the serial port by Arduino and plots them as vectors (the resultant vector is plotted as well). The MATLAB code is too long to present here, but I have commented my code thoroughly so it is easy to understand. I also included some code to record the plotting as a gif.
Gravitational acceleration as sensed by Arduino Uno + LSM303DLHC and plotted by MATLAB.

